Introduction
Security operations teams collect enormous amounts of telemetry every day. However, raw logs alone rarely provide the visibility needed to quickly identify threats and understand security trends.
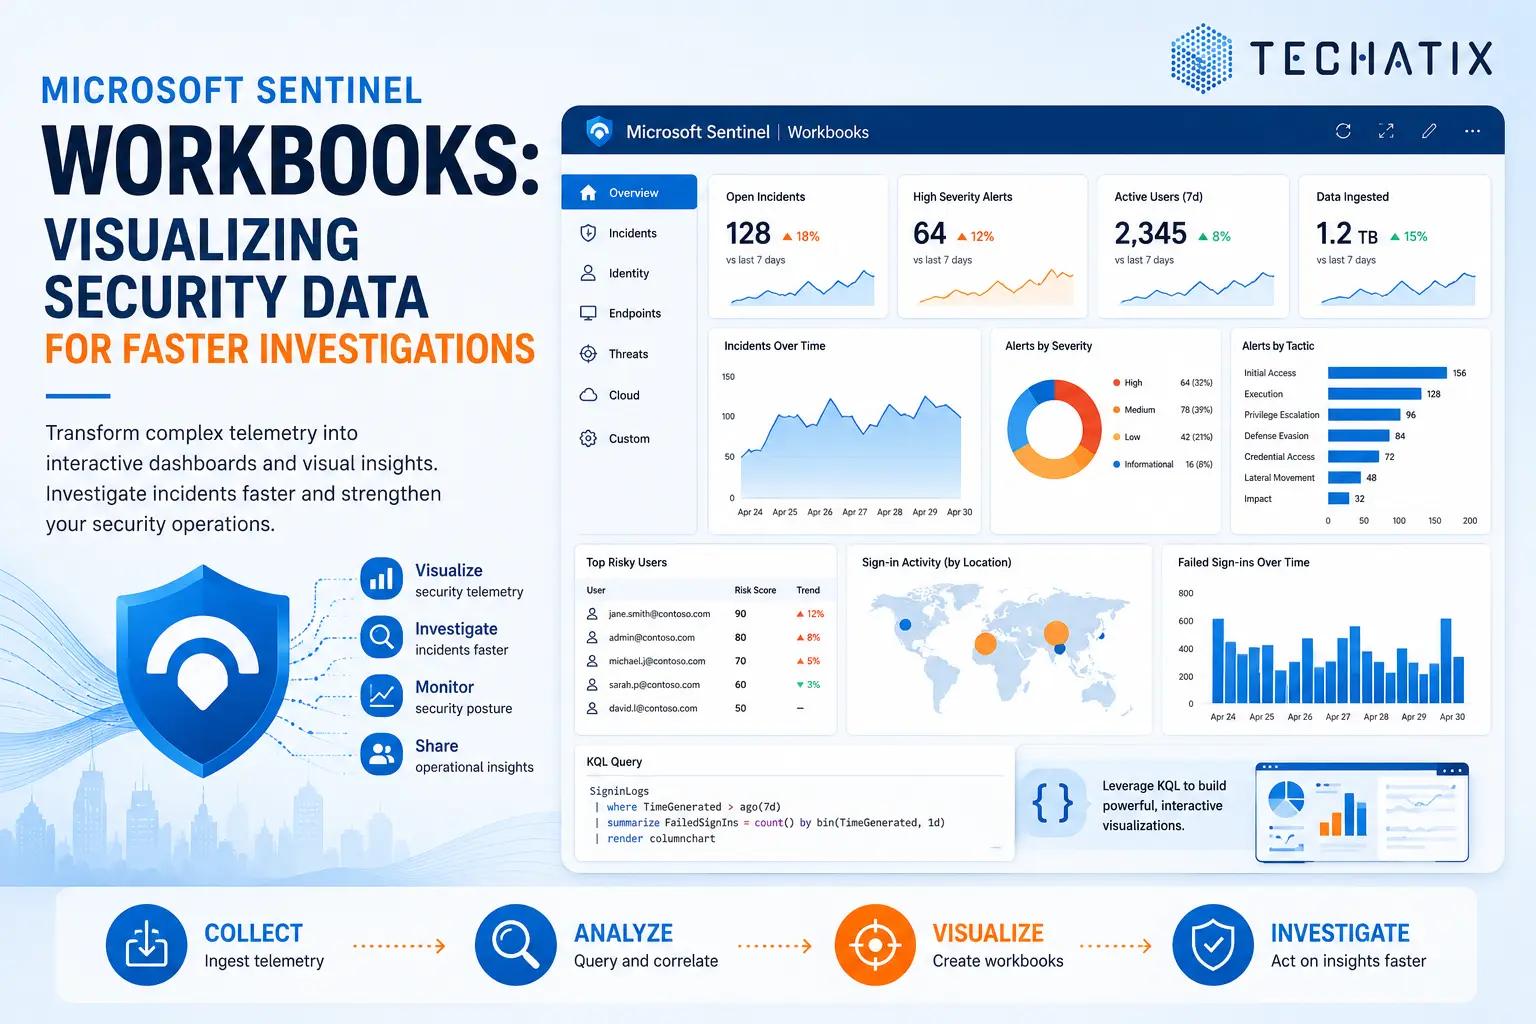
Microsoft Sentinel Workbooks help transform complex security data into interactive visual dashboards that enable faster investigations and more effective decision-making.
In this article, we'll explore how Microsoft Sentinel Workbooks work, common use cases, and best practices for building meaningful security dashboards.
What Are Microsoft Sentinel Workbooks?
Workbooks are customizable dashboards within Microsoft Sentinel that provide interactive visualizations of security data.
They allow security teams to:
- Visualize security telemetry
- Identify trends and anomalies
- Investigate incidents faster
- Monitor security posture
- Share operational insights
Workbooks can combine data from multiple sources into a single unified view.
Why Workbooks Matter
Security analysts often need answers to questions such as:
- Are failed sign-ins increasing?
- Which devices generate the most alerts?
- What are the current incident trends?
- Which users are considered high risk?
- Are attacks originating from specific regions?
Without dashboards, analysts must repeatedly run queries and manually correlate information.
Workbooks simplify this process by presenting security insights visually.
Key Components of a Workbook
Microsoft Sentinel Workbooks support multiple visualization types.
Charts
Examples include:
- Line charts
- Bar charts
- Pie charts
- Area charts
- Time-series graphs
Charts help identify trends and unusual activity patterns.
Tables
Tables display detailed security information including:
- User activity
- Incident details
- Device information
- Alert summaries
Maps
Map visualizations help analysts understand:
- Geographic login activity
- Threat origins
- Global attack patterns
Metrics
Metrics provide quick operational visibility such as:
- Total incidents
- High-severity alerts
- Active investigations
- Risky users
Common Sentinel Workbook Scenarios
Identity Monitoring Dashboard
Monitor:
- Failed sign-ins
- Risky users
- MFA activity
- Conditional Access failures
Identity-focused workbooks help organizations identify compromised accounts quickly.
Incident Overview Dashboard
Track:
- Open incidents
- Incident severity
- Mean time to respond
- Alert trends
SOC teams frequently use these dashboards during daily operations.
Microsoft 365 Security Dashboard
Visualize:
- Email threats
- Malware detections
- User risk activity
- Insider risk indicators
Endpoint Security Dashboard
Monitor:
- Device health
- Malware alerts
- Endpoint exposure
- Defender incidents
Executive Security Dashboard
Executives often require high-level security metrics including:
- Security posture trends
- Incident statistics
- Compliance indicators
- Risk summaries
Using KQL in Workbooks
Workbooks rely heavily on Kusto Query Language (KQL).
KQL allows analysts to:
- Filter telemetry
- Aggregate security events
- Correlate activity
- Generate custom visualizations
Example use cases include:
- Top targeted users
- Failed sign-in trends
- Device risk analysis
- Incident volume over time
Well-designed KQL queries are essential for effective workbooks.
Built-In Workbook Templates
Microsoft provides numerous pre-built workbook templates for common scenarios.
Examples include:
- Microsoft 365 Security
- Identity Monitoring
- Incident Review
- Threat Intelligence
- Defender XDR Integration
Organizations can use these templates as starting points and customize them based on business requirements.
Best Practices
Focus on Business Outcomes
Design dashboards that answer operational questions rather than simply displaying data.
Avoid Information Overload
Too many visual elements can reduce dashboard effectiveness.
Prioritize critical metrics.
Use Consistent Time Ranges
Standardized time windows improve comparison and trend analysis.
Tailor Dashboards to Audiences
Different stakeholders require different views.
Examples:
- SOC analysts need detailed telemetry.
- Security managers need trends.
- Executives need summary metrics.
Review and Update Regularly
As threats evolve, dashboards should evolve as well.
Regularly review workbook relevance and effectiveness.
Building Effective Security Dashboards
Effective workbooks help organizations:
- Improve visibility
- Accelerate investigations
- Reduce analyst effort
- Enhance reporting
- Strengthen security operations
Security dashboards should provide actionable insights rather than simply presenting data.
Final Thoughts
Microsoft Sentinel Workbooks enable organizations to transform large volumes of security telemetry into meaningful operational intelligence.
By combining visual analytics with interactive investigation capabilities, workbooks help security teams detect threats faster and make informed decisions.
Well-designed dashboards are a foundational component of mature security operations.
Need Help with Microsoft Sentinel?
Techatix helps organizations design, deploy, and optimize Microsoft Sentinel environments, including security dashboards, threat detection, and modern SOC capabilities.
Contact us to learn how we can help improve your security visibility.